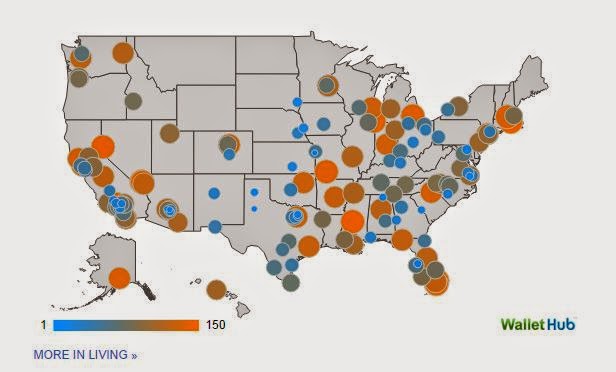
And the article:
Ranking Names Best Cities For People With Disabilities
The US survey considers 23 variables. Can we do something simpler for Canada? Here's what I came up with. A bit of a dog's breakfast of data, but probably not far off:- Population: Bigger is surely better, with more access to jobs and teaching hospitals
- Population Density: Compactness means services are handier, transportation networks closer
- Provincial Disability Rates: If people with disabilities are already there, services must already be in place
- Seniors: Ditto people over 65
- Receiving Adequate Care: Ditto
- Cost of Living: Cheaper is better (2002 = 100)
- Income Gap - difference between median incomes for people with disabilities and median family incomes for CMAs - smaller is better, but Wow! Look at those numbers!
CMAs are ranked on the 7 variables, ranks are averaged, and then ranked again. So all variables are given equal weight
Most of the variables in the US survey are at least indirectly accounted for except:
- Climate - This is Canada. Geez.
- Health insurance - ditto
Here's the map, dozen best in green, dozen worst in red. Vancouver is best. Halifax, where I live is tied for 8th. Edmonton is worst.
And a table to play with. Click a header to sort.
Here are the data sources:
- Statscan lists 33 Census Metropolitan Areas
- The Consumer Price Index table doesn't include all 33 CMAs (it shows history for selected ones), so I used the national average for missing ones.
- The age tables are for the entire province, but I included them as if the provincial rate applied to the CMA
- Ditto Disability - the legendary 2006 Participation and Activity Limitation Survey doesn`t go below provincial-level data.
- 2006 Income figures for people with disabilities
- 2006 Level of care received
- CMA Median Incomes

No comments:
Post a Comment